Tables, Listings, Graphs
Three words which have special meaning to experts participating in clinical trial analysis and reporting.
All the data collected in clinical trials – the research procedures which can lead to obtain a license for the product in case of confirmed safety and efficacy profile – are analysed and reported. The final report is the Clinical Report which summarises the obtained scientific results. This is highly based on the Statistical Report which interprets the collected data with the language of mathematics and statistics. This report is based on tons of tables, listings and graphs which were directly deduced from the statistical analysis of the collected data.

Find source here.
Preparation of TLG (the abbreviation of tables, listings and graphs) is associated to statistical programmers who can be considered centaurs with a body of a statistician and a brain of a programmer. They generally work in SAS an iconic and traditional analytical software.
SAS is inevitable in preparation of the TLGs, as the codebase of the biggest companies goes back decades, sometimes over 40 years. While SAS has some disadvantages. The pricing policy should be mentioned on the first place. But the problem of acceptance of SAS among the younger programmer generations is also a comparable problem. SAS language was developed between 1966 and 1976 – by the IT-guys lived there.
More and more program solutions today demand less programmatic and more business skills. This direction seems to be more attractive to the newer generations, so there is a strong pressure to get some alternatives of TLG generation in SAS.
While there are software tools similar to SAS (like SPSS, Stata or Cognos) the real competitors arrived from the GNU license world in the face of R (and more and more of Python). R is free of charge – at least on your own desktop – and easy to learn. While it is a couple of days to learn how to open and save a file in SAS, the same amount of time is enough to create your first 10 tables or graphs in R.
There are very strong support – called packages – to support clinical trial reporting with the help of R.
If you would like to know more, the very best source is webpage of R4CSR (R for Clinical Study Reports and Submission).
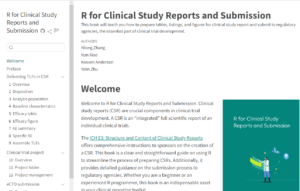
You can get a very well organized guide to each main aspects of reporting, like Efficacy, Adverse Event or demographic data reporting or best practice for setting up an optimal directory structure.
There are several specific packages to support the preparation of specif reporting demands. For example application of ANOVA (or GLM) is quite frequent in clinical trials and good templates were created during the decades.
Package “Flextable“ should be managed among the opportunities in formatting outputs tables with maximal flexibility. While this is not clinical trial inspired package it assures such fundamental features like pooling headers or internal cells, adding headers and footers.
Another important package can be considered in reporting is ‘Tableby“. If you are familiar with clinical reporting then this picture will also be familiar to you:
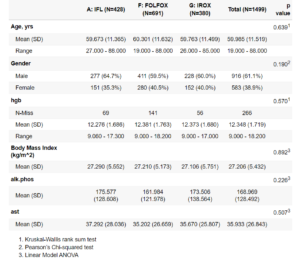
Find source here.
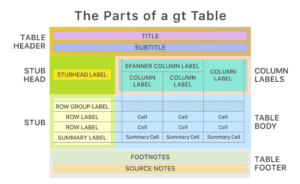
If you still have tasks uncovered by the previous solutions, you can try the ‘gt’ family (packages ‘gt’, ‘gtsummary’, ‘gtextras’, and some others). According to the ‘GT’ approach you can address each component of a table like shown in the graph below.
You might think that toolset should be enough for everything. It depends…. Because I have not mentioned the procedure of transforming the tables (outputs) into Word or PDF yet. This generally happens with the help of the Markdown technology that is – through HTML outputs. And if you would like to be the king in producing nice HTML-compatible outputs, you should use package ‘Table1“ on the first place.
If everything is so self-evident with R why the world is still travelling with SAS? To be objective, there are strong arguments not to drop SAS out of window. The main problem is around validation which is a difficult story to tell in short. Quality is still a very strong requimenent in drug development. And the conservative SAS environment is definitely a more valid system than an R one in which packages are developed by enthusiastic volunteers – with different, maybe undocumented programmic background. If you involve a package in your analysis performed in R in 2023, there is no guarantee for the availability of that package in 2025. This is quite normal in an environment where more than 20K packages are available, but this situation is untolerable for Authorities in the pharma world.
Putting aside the validation issues, the only thing I wanted to demonstrate that R really can be considered as an alternative tool to SAS in preparation of TLGs.